Check question demand with the Stack Exchange API (free, no account)
This guide shows how to use the free Stack Exchange API to count new questions per month for a candidate tag and a control tag. It covers the request pattern, the response format, and how to compare two monthly series. It does not cover keyword volume or what to write once the numbers are in.
Key takeaways
- Count new questions per month for your candidate tag and a control tag before you commit publishing slots to a topic.
- Compare decline rates, not levels: both series in the chart below fall across the window, and only the difference in decline rate matters.
- No account is needed. One request per calendar month per tag returns a plain total.
Why question volume belongs in demand research
A question is the most explicit form of demand a reader can send. Someone hits a real problem and posts a question in public, in their own words. Posting a question is stronger evidence than a keyword volume estimate, which only counts how often a phrase gets typed into a search box.
If new questions keep arriving month after month, tutorial and answer content still has an audience, and a clear answer can still win placement in search results. Pair the count with the search demand overview to see the other free demand checks in this guide series.
What the real data shows
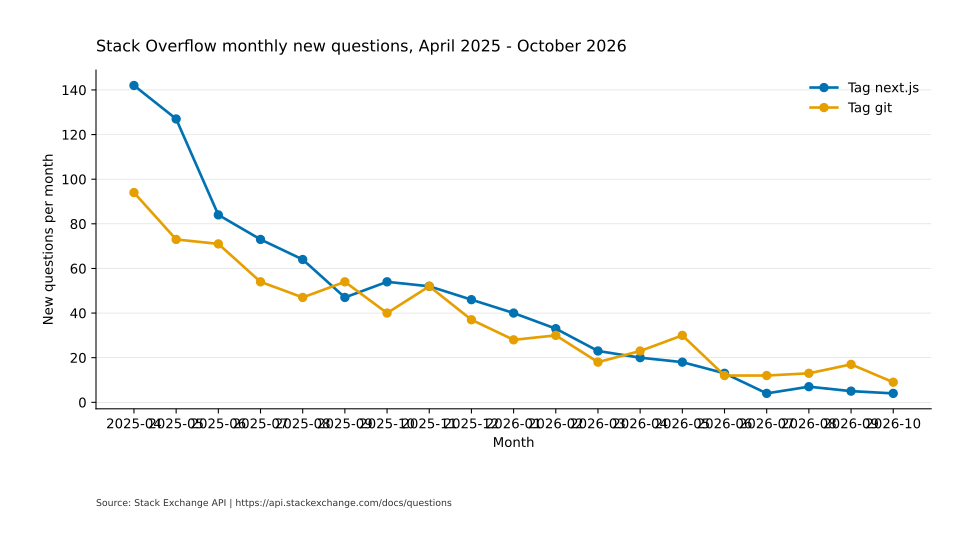
The chart shows the framework tag falling from 142 questions in April 2025 to 4 questions in October 2026, and the control tag falling from 94 questions in April 2025 to 9 questions in October 2026. Both series decline, but the framework tag falls by a factor of about 35 across the window while the control tag falls by a factor of about 10. The two series meet at 52 questions in November 2025, and the framework tag is down to 23 questions in March 2026. The level of either series says little on its own, because Stack Overflow as a whole shrinks over this window. Read the difference in decline rate instead.
The chart uses the month, nextjs_questions, and git_questions columns without interpolation. The CSV is copied without changes from datasets/search-demand/check-question-demand-with-stack-exchange-api/data.csv and is bundled beside this article as data.csv. The chart specification is at datasets/search-demand/check-question-demand-with-stack-exchange-api/chart-spec.json. Source and selection method are at datasets/search-demand/check-question-demand-with-stack-exchange-api/meta.json. Both series were fetched twice with identical results.
How to run the check yourself
-
Choose the candidate tag and the complete calendar months you want to count. Tags on Stack Overflow are exact strings, so confirm the spelling on the site before you build requests.
-
Build one request per calendar month for the candidate tag. The pattern is
https://api.stackexchange.com/2.3/questions?tagged=next.js&fromdate=1743465600&todate=1746057599&site=stackoverflow&filter=total. Thefromdateandtodatevalues are Unix timestamps in UTC, marking the first and last second of the month. Swap in a new pair for each month you check. -
No account and no API key are needed, and the anonymous daily quota is enough for a manual check like this one.
-
Read the response. With
filter=totalthe API returns{"total": N}, where N is the number of questions asked in that month with that tag. Record N, then move to the next month. Filters and parameters are described in the API reference. -
Repeat the requests for the same months with a control tag that holds steady, such as
git. Then plot both series on one chart and compare decline rates rather than absolute levels. A framework tag that falls faster than the control tag is the signal. A tag that tracks the control tag is not a signal.
What this method cannot tell you
- The signal exists only for technical topics covered by Stack Overflow. A local service or a consumer product has no tag and no questions to count.
- Levels understate real interest while Stack Overflow keeps shrinking; the meaningful comparison is how much faster one series falls than the other.
- Once monthly counts drop into single digits, one busy or quiet month can reshape a series, and small differences no longer carry signal.
- A tag is coarser than a keyword. It does not split by intent, so setup questions and troubleshooting questions land in the same count.
- Falling questions can mean better self-service rather than dying interest. Documentation, tutorials, and AI assistants may have absorbed the demand.
FAQ
Does falling question volume mean my topic is dying?
No. The decline of Stack Overflow itself dominates the numbers. Read the candidate tag against the control tag: a fall that matches the control tag’s pace is normal; a fall that outpaces the control tag’s pace is the signal to investigate further.
How do I pick the control tag?
Use a tag for a stable beginner-level topic, such as git, and fetch its counts over the same months on the same site. It should be something beginners keep asking about, no matter which tools are popular.
Do I need an API key or account?
No. The anonymous daily quota is enough for a manual monthly check. A key mainly raises that quota. A higher quota matters only if you automate the fetch on a schedule.