Check topic seasonality with Wikipedia page views (free, no account)
This guide shows how to check topic seasonality with free monthly data from the Wikipedia page views API. You will run one call per article, read the monthly series, and compare a candidate topic against a stable control before you set a content calendar. The check does not estimate Google search volume and does not replace keyword research.
Key takeaways
- The Wikipedia page views API is free and needs no account.
- Compare the candidate topic against a stable control before you commit dates.
- Publish ahead of the ramp: the climb begins about a month before the peak (100,366 views in October 2026).
Why seasonality decides your publishing calendar
A seasonal topic has a narrow window of interest. Publish in an off-peak month and the page lands in a quiet stretch. It gets indexed after the window has closed, earns little traffic, and then waits for the next cycle.
Run the check before you write anything. The Wikipedia page views API returns monthly totals for any article, and the monthly series shows whether a topic has a curve worth planning around or a flat line. The search demand overview lists the other free checks in this cluster.
What the data shows
Source: Wikipedia page views API
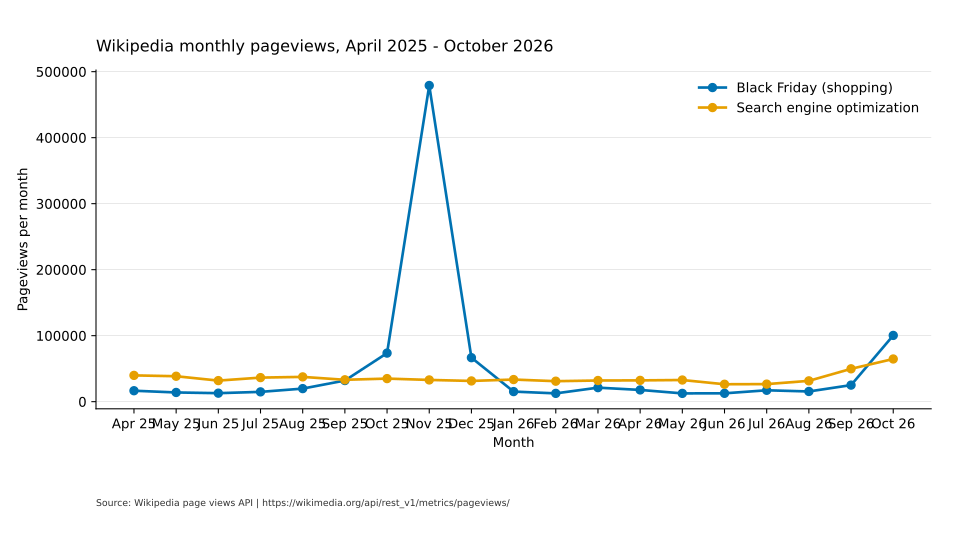
The chart follows two articles across the same window. The Black Friday (shopping) series has a steep seasonal shape. It passes 73,580 views in October 2025 on the way to 479,066 views in November 2025, then drops to 66,630 views in December 2025 and sits near its low of 12,551 views in February 2026. The peak is about 38 times the February 2026 low. The same series then climbs to 100,366 views in October 2026, so the next ramp starts about a month before the November peak. The Search engine optimization series stays in a narrow band for most of the window, like 32,248 views in April 2026, and then drifts up at the end, to 49,775 views in September 2026 and 64,670 views in October 2026. That slow drift is the kind of change a control comparison catches.
The chart reads the month, black_friday_views, and seo_views columns from datasets/search-demand/check-seasonality-with-wikipedia-pageviews/data.csv without interpolation; the selection method in meta.json drops the partial current month. The CSV is copied without changes and bundled beside this guide as data.csv. The chart specification sits at datasets/search-demand/check-seasonality-with-wikipedia-pageviews/chart-spec.json, and the source record sits at datasets/search-demand/check-seasonality-with-wikipedia-pageviews/meta.json.
How to run the check yourself
- Pick two articles: the candidate topic and a stable control in the same field. A control is any article whose interest you expect to hold steady.
- Build the URL. The pattern for one article, at monthly granularity, is
https://wikimedia.org/api/rest_v1/metrics/pageviews/per-article/en.wikipedia/all-access/user/ARTICLE/monthly/2025040100/2026110100. Replace ARTICLE with the article title, using underscores for spaces. The first timestamp opens the window and the second closes it. - Open the URL in a browser: no key, no account, no sign-up. The same call runs from curl if you prefer the terminal.
- Read the JSON. The response holds an
itemsarray. Each item carries a timestamp, the article, the access method, the agent, and the view count for that month. Keep the monthly totals and ignore the rest. - Keep only complete months: a partial month shows a low total that reads as a drop, which is why the chart above ends on a complete month.
- Run the same call for the control and plot both series on one chart, the way the chart above pairs Black Friday (shopping) with Search engine optimization. A seasonal topic shows a curve. A control holds steady. Read the two together.
What this method cannot tell you
Wikipedia page views are not Google search volume: one measures how often a single encyclopedia article is read each month, while Google Trends counts typed queries on Google. The two can move in different directions, so treat the curve as a shape check rather than a demand forecast.
An encyclopedia article is not your niche keyword. Wikipedia tracks a broad concept while your page may target a narrow angle the article does not cover. The agent filter in the call removes bots from the count, but every remaining view comes from a reader of one encyclopedia — a reader who is not a confirmed customer and may not overlap with your market.
A flat line is not a verdict on the topic. A subject can hold steady on Wikipedia and still carry consistent search demand for your site. Use the chart to reject the wrong calendar, not to size the traffic.
FAQ
Are Wikipedia page views the same as Google Trends?
No. The Wikipedia page views API counts views of one encyclopedia article by month. Google Trends reports relative search interest for a query, so the two numbers answer different questions.
Should I publish in the peak month?
Publish before the ramp, not in the peak month, so the page is indexed and settled when interest arrives. The Black Friday (shopping) series already reaches 100,366 views in October 2026, a full month before the November peak.
Do I need an API key or account?
No. The call works in a browser with no key, no account, and no sign-up. Heavy automated use runs into rate limits, but a manual check for one topic will not hit them.